blog
The Four Dashboards Every Manufacturer Needs to Optimise Production
Aug 20, 2020
Read our new and updated blog about manufacturing dashboards:
Imagine driving a car where the dashboard reports yesterday’s speed and distance covered. It sounds odd but this is how many are operating their factories. They know the previous day’s output and OEE numbers but that is of little help in maximising today’s performance. What they need are manufacturing dashboards that display real-time, actionable insights.
The dashboard concept isn’t new in business. In manufacturing, however, it’s only recently that businesses have been able to collect and analyse real-time data from production equipment, ERP, and MES systems. Today, though, intelligent manufacturing solutions that turn data into valuable insights make manufacturing dashboards a reality.
In this blog post, we show you the manufacturing dashboards that provide you the insights and awareness you need to optimise your production.
A manufacturing dashboard is a real-time visual representation of a manufacturing process. It displays, typically in graphical or chart form, the key KPI or metrics that indicate performance. Just like in cars, dashboards present the key things required to make good operational decisions. This way, users don’t get overloaded with complex information.
Manufacturing dashboards present data and insights from machines, sensors, and systems in a user-friendly way. They help manufacturers monitor and optimise production quality and efficiency. At the same time, manufacturers gain insight in specific operations. Through dashboards, organisations can quickly see their current and historical performance.
Manufacturing dashboard benefits
First, let’s consider how supervisors, managers and directors get their production performance information without a real-time dashboard. Traditionally they have been using paper reports and spreadsheets, and then supplemented that information with what the Manufacturing Execution System (MES) and Enterprise Resource Planning (ERP) systems can provide.
Management gets their metrics-related production information from the previous shift or day. Machine status and performance against targets are examples of the kind of information. At this point the data is already 12-24 hours old. Managers then summarise this information as status reports for the directors. Typically, there’s a focus on performance against plan and direct costs. By the time it reaches the director’s desk the data could be days old. Senior management is trying to steer a car by looking in the rear view mirror.
Real-time manufacturing dashboards change this completely. Here are four big benefits that dashboards offer:
1. Make complex information simple
In fact, according to Aberdeen research, real-time dashboard users have improved their time-to-decision at a rate 2.5 times greater than those who didn’t use dashboards over the last two years. For example, you can be confident about adjusting equipment or open new lines to increase throughput at the right time. Also, production meetings are more effective when you have the right information to hand!
2. Give the right information to the right person at the right time
Dashboards are flexible by nature. They can take most sources of information and transform that data into insights that can be used to get a better understanding of operational performance. Thus, dashboards can be highly personalised, delivering the right information to the right person at the right time. For example, a Vice President might be interested in KPI’s that affect monthly results, such as cost reductions or risk management. A plant manager focuses on daily metrics such as production, quality or costs. A supervisor, on the other hand, would probably want to track information about machine status, production, yield and scrap levels. And, an operator would focus on shift, hourly or real-time metrics.
Given the different needs, it is important to understand and cater to the needs of various users when presenting them insights. This simplifies greatly the effort in getting everyone to use the dashboards and to start improving processes, throughout the organisation.
A well thought out series of metrics, along with a program to manage them, help companies achieve organisational agility. This enables everyone to react faster to changes in the manufacturing or supply chain environments.
3. Gain complete visibility of production lines
Real-time line visibility is critical for efficient operation. Manufacturing dashboards enable you to see exactly what’s going on with production lines at any given time. You can see what’s working, and what’s not, where the bottlenecks are, and much more.
With tight operational margins, manufacturing relies on a growing number of factors. To succeed in optimising company-wide operations, it is not enough to focus on optimising individual machines or lines. Instead, you need to include areas such as scheduling, budgeting, operational performance, and logistics (to name but a few) to function as part of a well-oiled machine to remain profitable.
Dashboards help you do precisely that. In fact, they are able to integrate the data from various sources (such as ERP, MES, automation system, and even Excel files) into a cloud repository. This allows you to not only monitor the performance of a single factor, but to compare factors and monitor how their relationships affect each other. Also, you can generate trend analysis that gives you the ability to monitor the flow-on effects between different manufacturing departments and significantly reduces the time spent compiling and aggregating different data sources.
4. Manufacturing dashboards every manufacturer needs
Curious to see what you can track with Elisa Smart Factory Dashboards? Let’s take a look at a few examples of the types of dashboards available.
For many plant managers, factory is a “black hole”. Essentially, they know when work orders and materials enter the factory and when finished goods leave, but they don’t know what’s happening in the production. Even though enterprises have invested in ERP and MES systems to alleviate the problem, they have not been able to unlock the needed data to know what is really happening in their operations, what the inefficiencies are etc.
3D Digital Factory provides real-time insights on what is happening on the shop floor at one glance. Specifically, it eliminates the need to wait for information to flow up from the shop-floor, whether it is related to a problem with equipment or materials. The data-driven visualisation enables decision-makers to readily understand what is important to focus on at any given moment. This, in turn, helps making better and faster decisions, significantly reducing the need to rely on gut-feelings and opinions.
In addition to seeing a real-world matching 3D visualisation of your factory, it is easy for managers to understand how the production is doing. Color-coding makes it quick to see if production is running as planned, or if a machine, for example, is going through planned or unplanned downtime. The data labels on each machine show how the production is progressing against set KPI targets.
Get a bird’s eye view of your entire operations with 3D Digital Factory


Line Manufacturing Dashboard is your one-stop-shop for production insights
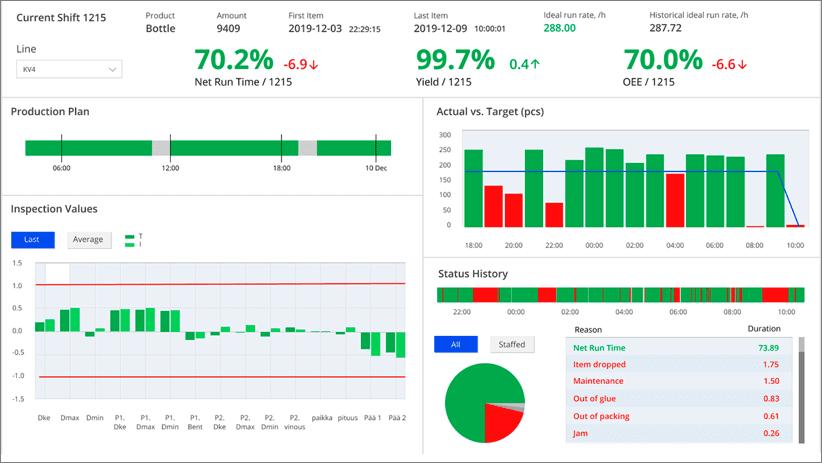
The line dashboard above is a one-stop shop for production insights. It helps to monitor the most important production KPIs in one central point of access and to keep the whole team aligned.
At a glance, line managers can see how production is going on a given day and whether or not their team is meeting their goals. The Line Dashboard provides the perfect overview of the progress of the shop floor. It focuses on various manufacturing KPIs: OEE, Yield, Equipment Availability, Performance, FPY and more. Having all the important KPIs related to the production on one dashboard provides a great way to start spotting optimisation opportunities. Inefficiency is the nemesis of any manufacturing process, so you must stay alert and track any potential issue, spot any hidden trends that could harm the processes.
Dashboards that work for you
The Line Dashboard consists of customisable elements or sections, letting you mix different metrics and visualisations for those metrics in the same dashboard. Currently available elements include:
- Batch Status, which offers insight into schedules, delays, amounts produced, scrap count and ideal run rate. It provides an overview of batch transactions and associated key metrics.
- Batch/Volume Target provides a forecast of the amount of time or the speed with which a batch or process is completed. This KPI revolves around production efficiency, and tracks how effectively production is managed to optimise output.
- Production Plan imports the planned production schedule from your ERP, MES or Excel sources into the dashboard, making it easy to track your performance against the plan at one glance.
- Status History outputs real-time information about production status and loss distribution per category. It helps to understand your top sources of list manufacturing productivity, track them and start driving continuous improvement.
- Actual vs Target chart shows how the actual production is compared to the planned production during a specific time frame. This is an easy way to know whether or not you’re meeting your production goals hour by hour.
- Item Status History shows status of recently produced items with simple color coding. If there are any anomalies or errors detected, those are flagged in Automatically Identified Issues.
With KPI History trends you’ll know your progress towards your goals
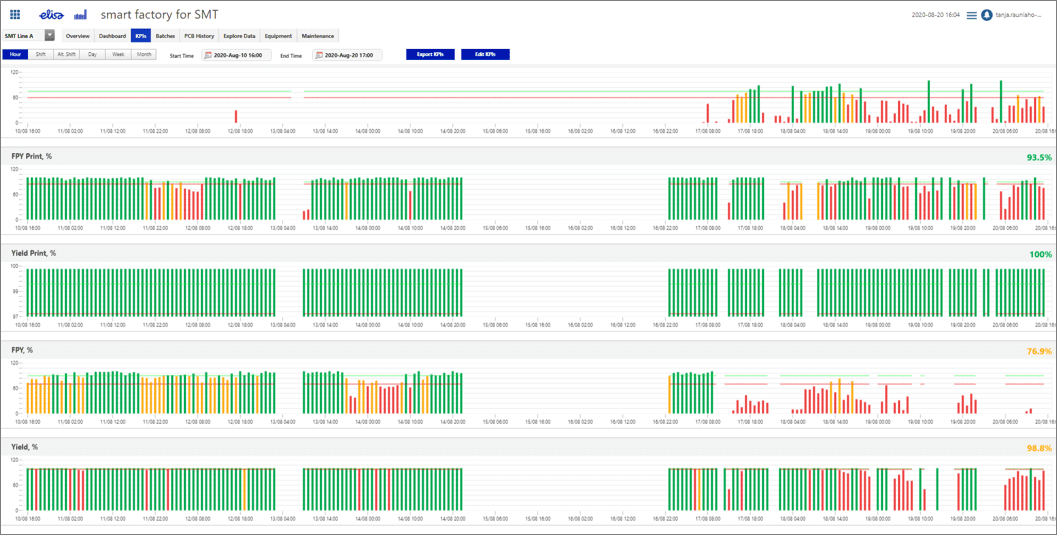
It is important to constantly evaluate operations. The KPI History Dashboard offers an excellent way for users to track key KPI trends in operations over time. By doing this, they ensure that the company is operating within its defined parameters.
Using KPIs to track business objectives not only forces teams to ground themselves in data but empowers them to engage in a cycle of continuous improvement.

Minimise risks to quality with Batch/Item History and failure classification
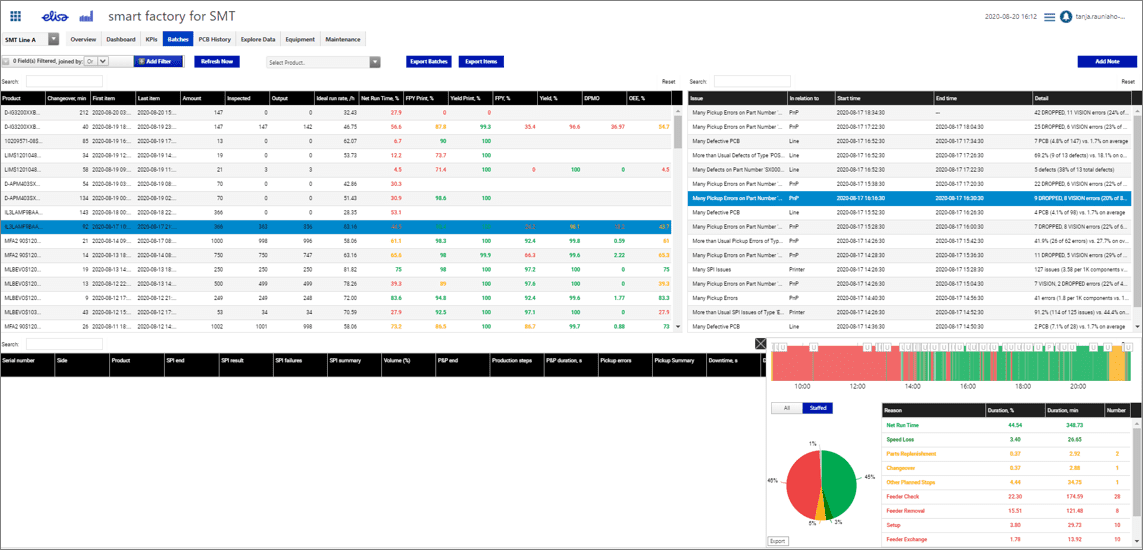
Batch History delivers information about batches, batch-level KPIs, and issues encountered during the batch production. In addition, it allows users to explore data on individual items belonging to a batch. The information is automatically collected and stored from process events.
It is crucial to keep track of the batches which have been executed and which are still in processing phase to understand how efficiently and accurately a company can perform its tasks.
Collecting a comprehensive history of product batch data is the first step to improve the performance of any process. Once you understand what is happening in your process and why something is happening, you can start optimising the production. With help of the insights, you can reduce material costs, increase productivity and plant utilisation, and improve product quality.

Conclusion
Almost every business can benefit from having a dashboard that aligns with their objectives. Operating without them makes conceptualising hard numbers more difficult and opens up the chance of missing patterns that would be more obvious if visualised. They are an important tool for any decision maker and help drive and guide the business in the right direction.
Want to learn more about how our dashboards can help you, please contact us.
Read our new and updated blog about manufacturing dashboards:
How To Improve Resilience And Grow Your Business Sustainably
Unexpected disruptive events in manufacturing always interrupt normal production conditions and cause production loss. How resilient are your planning and manufacturing processes? Are you prepared to deal with the unexpected?
Take the quiz below to find out how your organisation stacks up in the face of crisis and get expert insights on how to make your manufacturing more resilient.
